
Today I am starting a series of posts in which I will present my research to date on the work of managers and the search for an answer to the fundamental question: what do managers really do? As I have written many times before, the lack of such an answer is one of the main reasons that we can’t buy an artificial manager for the company like we buy a coffee machine.
Over the past 10 years, I have conducted a great many experiments, non-participatory and long-term observations on what managers do in different situations and while executing different projects. All of them were based on the System of Organizational Terms theory (see more: http://olafflak.home.pl/artificialmanagers/system-of-organizational-terms/) and online managerial tools on the TransistorsHead.com platform that has been developed over the years (http://transistorshead.com/).
The first experiment was conducted using a non-participant observation technique from the beginning of April to the end of June 2013. The observation group consisted of students of the management specialty at the University of Economics in Katowice. The participants of the observation were tasked with preparing a complex management innovation project, consisting of a managerial tool in the IT version and a description of the techniques for using this tool.
To set goals and tasks in this project, the participants used managerial tools – Goaler and Tasker, respectively – which are tools for measuring the organizational quantities of the primary: goal and task. In the observation carried out, we recorded the activity of 8 managers and obtained data on two organizational primary sizes, which made it possible to visualize organizational primary and derived sizes in the form of an organizational reality model in the form of a graph. Let me remind you that the primary and derived organizational size gives us the total of managerial activity, that is, what we mean by the question: what does a manager actually do?
Returning to the experiment, despite the fact that the participants in the experiment planned the same undertaking, the activities undertaken (the goal-setting process and the task-setting process) of each of them had a different time course. This meant that the various organizational quantities occurred at different points in time and in different order.
The collected data not only made it possible to see in what order organizational activities appear as a function of time, but also contained information about the values of the measured quantities that were assigned to goals and tasks as primary organizational quantities. As a result of editing the predetermined goals or tasks, the values of measured quantities also changed as a function of time. In this way, causal relationships or co-occurrence relationships between managerial activities could be observed.
In Figure 1 and Figure 2 you can see how the managers of the two teams behaved differently. The symbols are: C – goal, Z – task. The first digit is the number of the object (goal or task) and the second digit is the version of that object (goal or task). The colors of the arrows indicate different activities:
- Green – creating an object
- Red – editing an existing object
- Blue – viewing an object without changing it
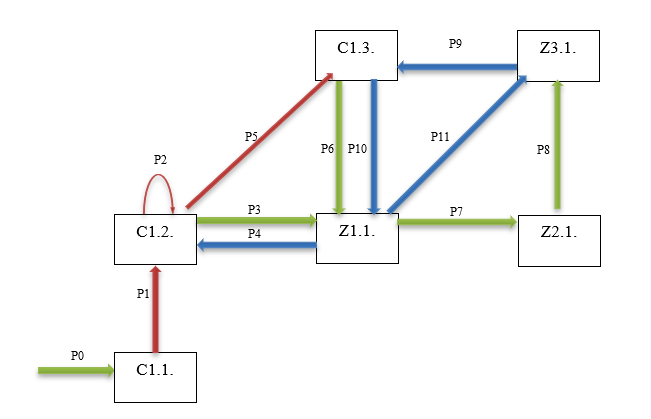
Figure 1. Managerial activities and their outcomes (goal or objective) of manager 1
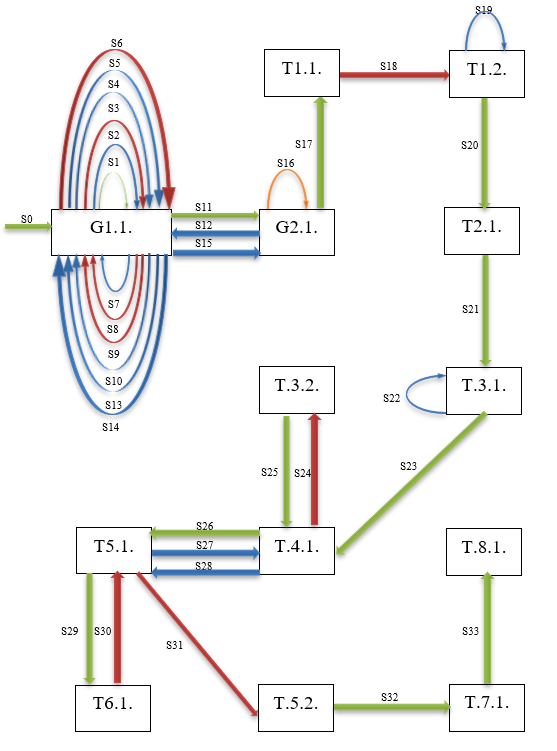
Figure 2. Managerial activities and their outcomes (goal or objective) of manager 2
Read the full results of the study here:
Flak, O., Results of Observations of Managers Based on the System of Organizational Terms
But this is not the end of the story. In the next post, I’ll show you what managers said about their work and what an artificial manager would learn from them.