In a previous blog post, I presented an example of how graph theory can be used for two simple managerial activities – setting goals and defining tasks. Today, I’ll continue this thread and show more details from the same experiment I recorded using TransistorsHead.com’s online managerial tool.
The experiment consisted of assigning managers to 3 groups of students in those groups, and each group was to prepare a plan for a small project, consisting of goals and tasks. All of them worked with online managerial tools – goaler and tasker, for setting goals and defining tasks, respectively – which were also measuring instruments, recording their activity. I will describe more extensively how online managerial tools work in future blog posts.
I presented the proceedings of the first manager, illustrated in graph form, in a previous post:
Now let’s look at the other two managers. In the figures below, Gn.m. stands for Target with the number n and version m. And Tq.r stands for the task with the number q and version r.
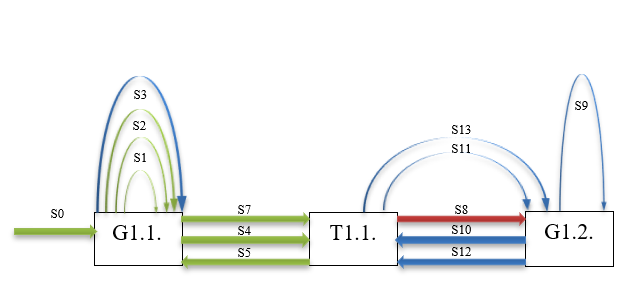
You can see the proceedings of the first one in Figure 1. I have called this manager a sparing manager.

Figure 1 An example of a manager’s conduct – a frugal manager
His conduct was as follows. The manager tried four times to create a G1.1. goal (activity S0, S1, S2, S3), then created a T1.1. task (activity S4), then tried again to create a G1.1. goal (activity S5), then looked at this G1.1. goal (activity S6), tried again to create a T1.1. task (activity S7), then went to edit the goal and converted it into a G1.2. version (activity S8). He then looked at that G1.2. target for himself (activity S9) and went back to looking at the T1.1. task he had created (activity S10). After that he looked at the G1.2. target for himself (activity S11), and then looked at the T1.1. task (activity S12), and finally read the contents of the G1.2. target again (activity S13). You will admit yourself that he did not do much (only one goal and one task to achieve it), and he got very tired….
The conduct of the second manager is depicted in Figure 2. I call him a manager with momentum.
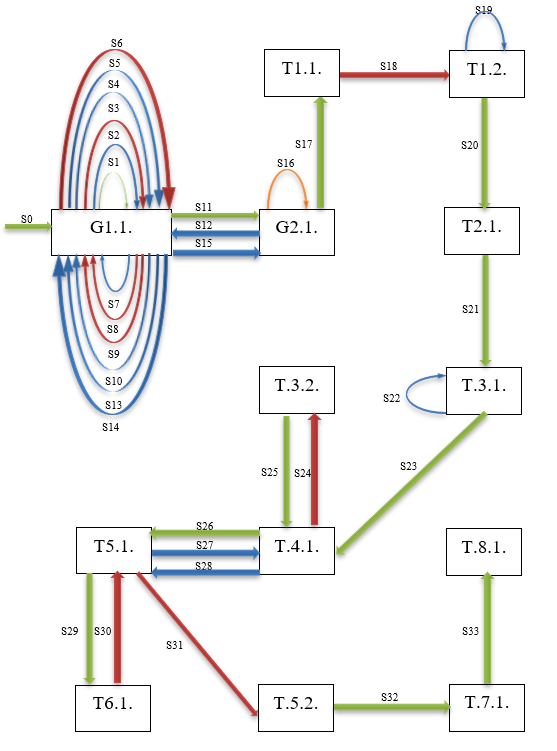
Figure 1 An example of the manager’s behavior – a manager with momentum
You will admit yourself that at first he was going around in circles (activities from S1 to S14), but when he got rolling, he created or edited two goals and 8 tasks.
If you’re a manager, this is how you can present yourself, as long as you have enough attention to note down everything you do. And then it’s just a step, so that with this knowledge of what you do, you can be automated….
Read the entire article on the study here:
Results of Observations of Managers Based on the System of Organizational Terms